A website going down is rarely convenient.
Sometimes it is obvious. You deploy a change, the homepage returns an error, and you know exactly where to start looking. Other times, things are less clear: the site works for you but not for everyone, DNS has changed unexpectedly, a certificate is close to expiring, or a security layer is challenging automated requests.
That is why we built WebCheck.
WebCheck is now available in open beta at webcheck.notabis.com, giving webmasters, developers, and small teams a straightforward way to keep an eye on the websites that matter to them.
It is designed to answer a few simple questions:
- Is the site reachable?
- Is it responding normally?
- Has anything important changed?
- If something has gone wrong, when did it start?
- Is it recovering, or is the problem still active?
Monitoring the parts that matter
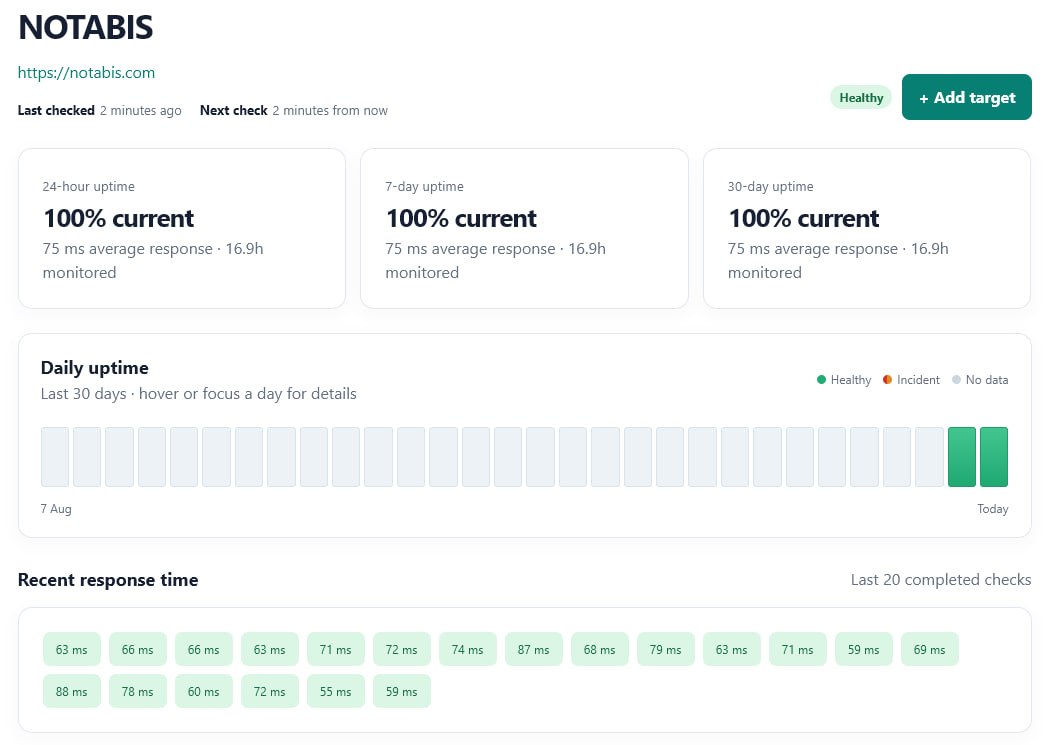
WebCheck starts with regular HTTP availability checks. These make a request to your website and record whether it responds successfully, how long it took, and whether the response looks healthy.
That includes useful details such as:
- HTTP status code
- Response time
- Time to first byte
- Redirect behaviour
- Response size
- Connection and transport errors
A slow response is not always the same as downtime. A website can be technically available while becoming noticeably sluggish, so WebCheck keeps degraded responses separate from confirmed failures.
That distinction matters. You do not want every slow request to cause unnecessary alarm, but you also do not want gradually worsening performance to go unnoticed.
HTTP, DNS, and TLS checks
WebCheck does more than request a webpage.
Depending on the target, it can also check:
- DNS records, helping you spot unexpected or incorrect DNS changes
- TLS certificates, including certificate validity and hostname coverage
- Security headers, such as headers that help protect visitors and browsers
- Domain expiry information, where that data is available
These checks do not all need to run at the same frequency.
HTTP availability is checked regularly because websites can change or fail at any time. DNS, TLS, and domain information normally change less often, so those checks use longer intervals. This keeps monitoring useful without repeatedly querying services that rarely change.
You can always run an individual check manually when you need a fresh result.
TCP monitoring for services beyond the browser
WebCheck can now monitor TCP services as well as websites. A TCP check performs a bounded TCP CONNECT to a hostname and port, recording connection timing without sending payloads, performing handshakes, scanning, or collecting banners.
You can use TCP monitoring for services that do not have a webpage, such as a database endpoint, game service, mail service, or other application listener. Hostnames and ports are validated, ports must be between 1 and 65,535, and connection timeouts are bounded.
Private, loopback, link-local, and reserved network addresses are blocked. Failures are reported using clear, sanitised categories such as DNS resolution failure, connection refused, connection timeout, or general connection failure.
TCP checks use the same scheduling, history, confirmation thresholds, incidents, notifications, and recovery flow as the other WebCheck monitor types.
Incidents that explain what happened
A list of failed checks is not particularly helpful on its own.
WebCheck groups related failures into incidents and shows the story around them:
- The first failure
- The point at which the outage was confirmed
- Any preceding warning signs
- Recovery checks after the service comes back
A single failed request may be a temporary network problem. WebCheck looks for consecutive failures before treating an issue as a confirmed incident. The incident view shows the threshold used, so you can see why an outage was opened instead of having to guess.
You can also filter the timeline to show:
- All checks
- Failures only
- Recovery checks
- Preceding context
That makes it easier to investigate a problem without losing the useful evidence around it.
History without the spreadsheet headache
Monitoring history can quickly become a lot of raw rows.
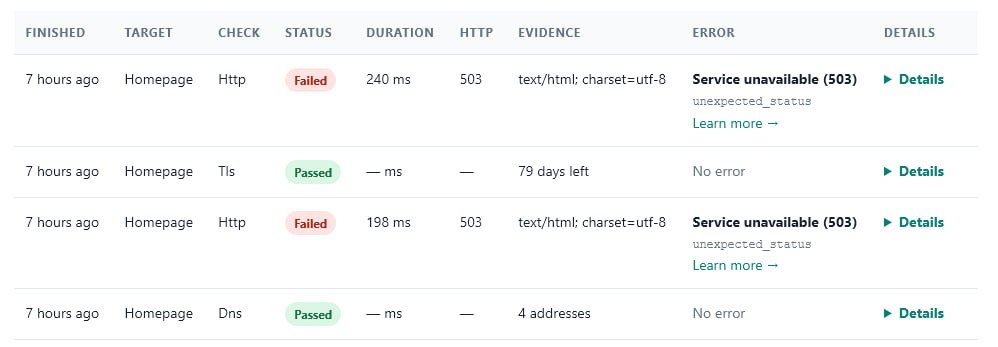
WebCheck keeps the history table compact while allowing you to filter it by:
- Date range
- Target
- Check type
- Status
- Error category
- Failures only
- Slow responses
- DNS, TLS, or TCP changes
Each result can also be expanded to show more detail, including the exact timestamp, response information, error explanation, and technical evidence.
The goal is not to overwhelm you with every possible metric. It is to make the important evidence available when you need to investigate something.
Alerts that answer the useful questions
An alert should not simply say, “Check failed.”
It should help answer:
- What broke?
- When did it start?
- Has the failure been confirmed?
- How serious is it?
- What should I check next?
WebCheck alerts include a friendly diagnosis, the first failure time, the confirmation time, the number of failed checks, and a direct link to the incident.
Recovery alerts include the incident duration, so you can see how long the problem lasted rather than receiving a vague “everything is fine again” message.
You can also choose to delay notifications until an incident has continued for a set period. That is useful for avoiding alerts caused by very short interruptions while still being notified about problems that persist.
Notifications are deliberately kept separate from the monitoring process. If an email, webhook, or other notification fails, the monitoring job should still complete and record its result.
Public status pages
If you maintain a service for customers or a community, a public status page can save a lot of repetitive support messages.
WebCheck status pages can show the operational state of selected components, recent incidents, and public recovery information without exposing private monitoring configuration or internal diagnostics.
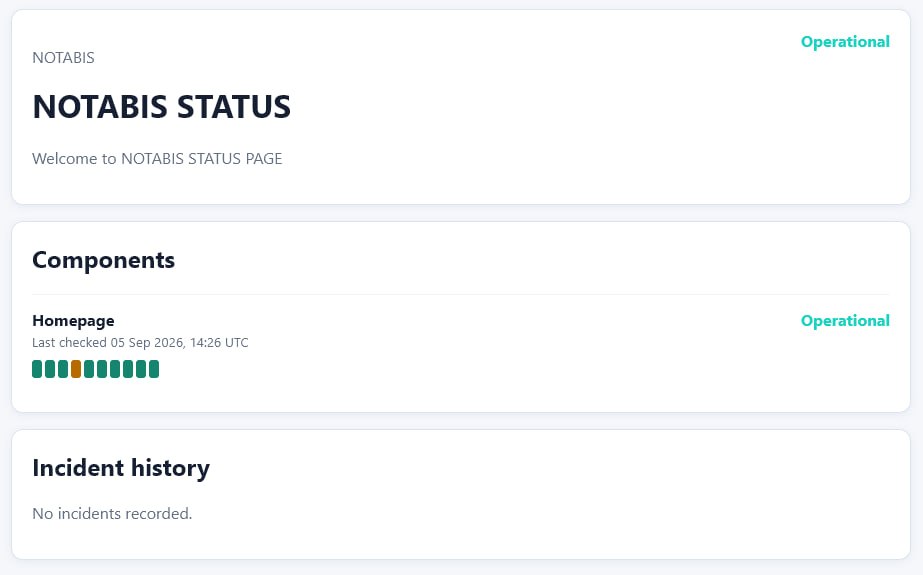
They also support presentation options such as:
- Custom page title
- Brand name
- Logo
- Brand colour
- Maintenance mode
- Public notes
- Component history
- Last-updated information
A status page should not pretend that nothing is happening when you are actively carrying out maintenance. Maintenance mode gives you a simple way to communicate that clearly.
Built for small teams and real-world websites
WebCheck is aimed at people who want useful monitoring without having to assemble and maintain a large monitoring stack themselves.
That includes:
- Freelancers managing client websites
- Developers running personal projects
- Small businesses
- Indie software teams
- Agencies looking after multiple sites
- Anyone who wants an early warning when a website starts misbehaving
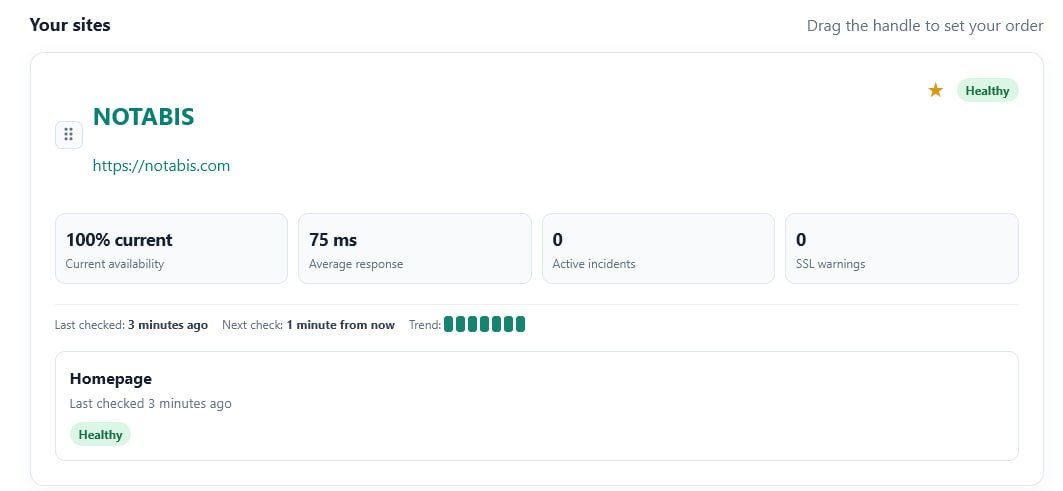
The interface is deliberately straightforward. You can see which sites need attention, when they were last checked, when the next check is expected, and whether recent results are trending in the wrong direction.
New websites also show an initial-scan state, explaining what is being checked and why uptime percentages need enough history before they become meaningful.
This is an open beta
WebCheck is now in open beta, which means the core product is ready to use, but we are still improving the experience based on real-world feedback.
Monitoring is only useful when it is understandable and trustworthy. We would rather keep refining the details — clearer incidents, better explanations, and more useful alerts — than add features simply for the sake of a longer feature list.
If you try WebCheck, we would especially like to know:
- Which information you look for first when a site fails
- Whether the incident timeline makes sense
- Which alert details are most useful
- Which checks you would like to see added
- Where the interface could be clearer
You can try WebCheck now at webcheck.notabis.com.
Hopefully, it gives you one less thing to worry about when you are looking after a website.